Week 7: Analysis III
-
Examine the following Quantile-Quantile (Q-Q) plot, and indicate which answer correctly describes the distribution of data.
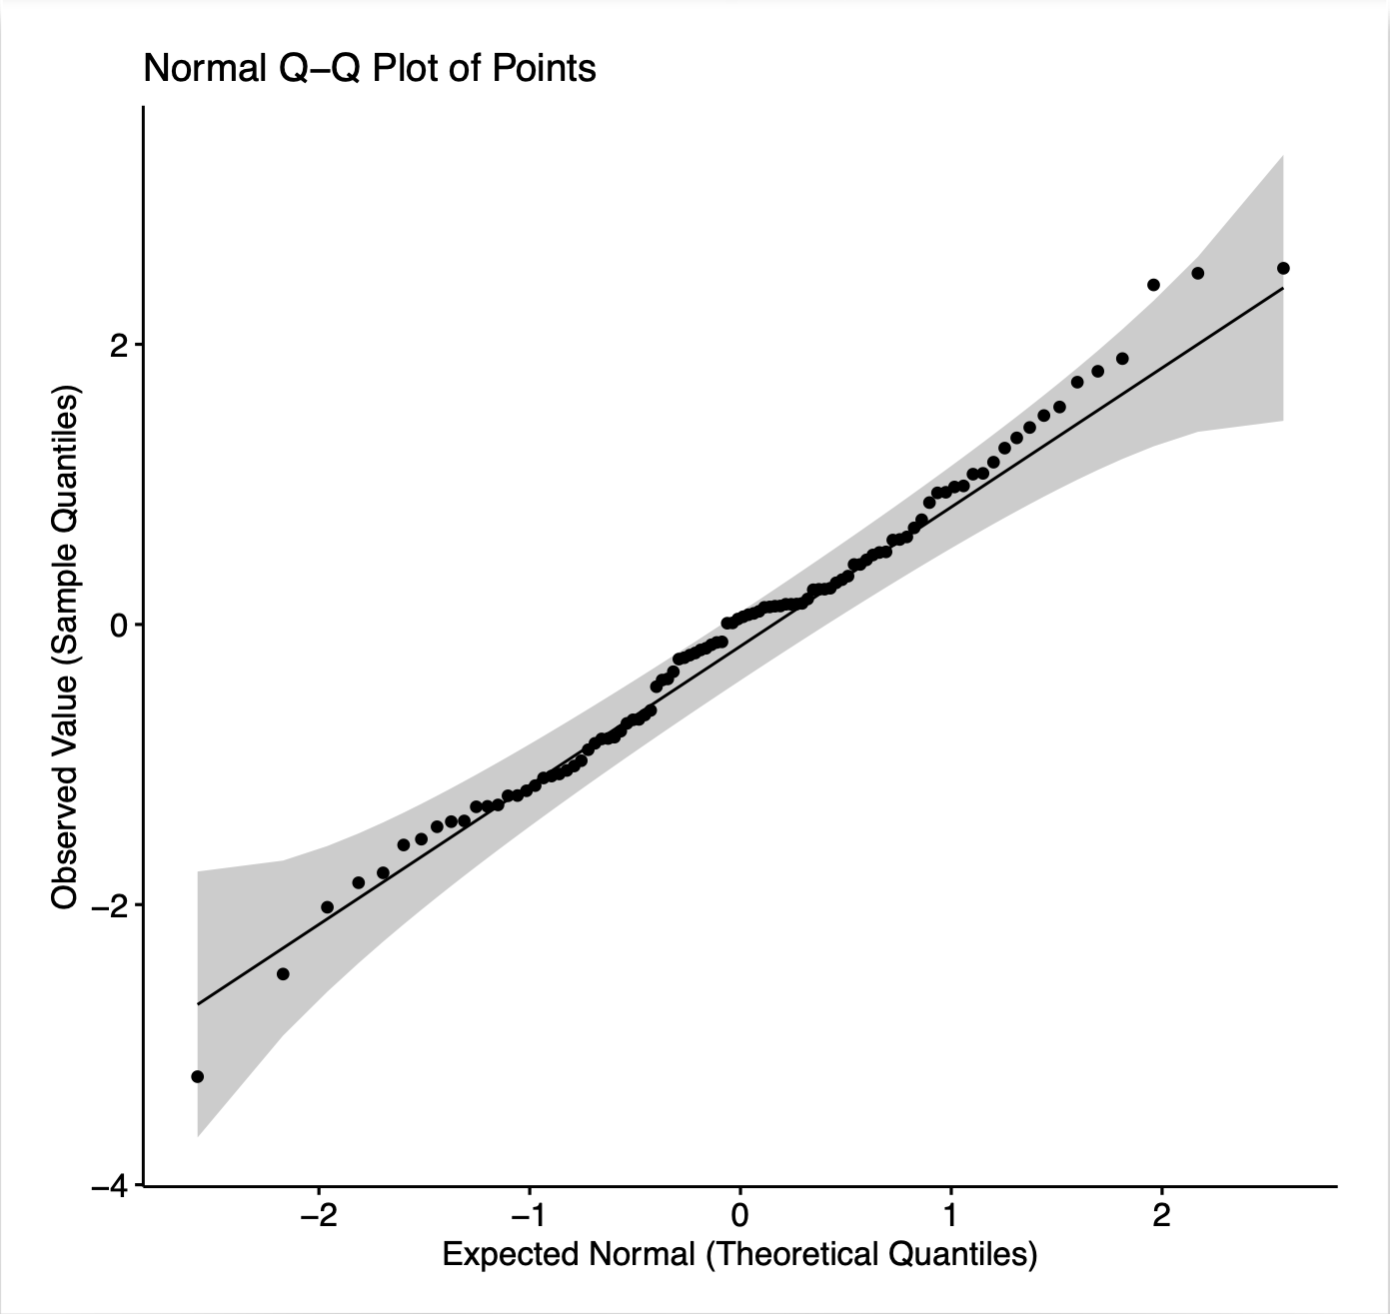
- Q-Q plots are used to visually assess homogeneity of variance (homoscedasticity), and the data here is homoscedastic.
- Q-Q plots are used to visually assess homogeneity of variance (homoscedasticity), and the data here is heteroscedastic.
- Q-Q plots are used to visually assess normality, and the data is almost normally distributed.
- Q-Q plots are used to visually assess normality, and the data is not at all normally distributed.
-
Closely examine the following table obtained in SPSS after conducting Levene’s test, and choose the correct answer below.

- Levene’s test is used to assess the homogeneity of variance, and the results show that ‘Variable’ is homoscedastic.
- Levene’s test is used to assess the homogeneity of variance, and the results show that ‘Variable’ is heteroscedastic.
- Levene’s test is used to assess the normality of distribution, and the results show that ‘Variable’ is normally distributed.
- Levene’s test is used to assess the normality of distribution, and the results show that ‘Variable’ is not normally distributed.
-
You have collected data on vitamin D levels for groups of Finish, Dutch and Italians. Your data is non-normally distributed. Which non-parametric test are you going to use to find if there are any significant differences among these groups?
- Independent Samples t-test
- Kruskal-Wallis test
- Friendman’s test
- Chi-square test
-
Regression analysis was used to examine the relationship between the amount of time students spent (x; in hours) studying and their exam scores (y) for high school students. The following regression equation was obtained:
y = 31.9 + 0.84 x
Based on the estimated regression equation above, if the amount of time were increased by 1 hour, which of the following choices would apply?
- Exam Score will increase by 0.84
- Exam Score will increase by 31.9
- Exam Score will increase by 32.74
- Exam Score will decrease by 0.84
-
Which of the following is not a measure of the goodness of fit of a linear regression?
- Coefficient of Determination
- Intercept
- Residuals
- Standard Error
-
A Pearson’s correlation of r = 0.7 was found between time spent studying and exam score. What is the proportion of variance in exam scores that can be explained by time spent studying?
- 0.70
- 0.49
- 0.07
- 0.14
-
Consider the following multiple regression:
z = 21.3 -3.4x + 0.6y
If the coefficient of determination (R2) for this regression model is 0.81, what does the value indicate?
- The standard deviation of the residuals is equal to 0.81.
- The proportion of variance explained by this model is 81%.
- The model is not statistically significant.
- The goodness of fit is 0.81.