Week 5: Analysis I
- Which of the following lists has the highest standard deviation?
- 98, 99, 100, 101, 102
- 2, 5, 6, 8, 10
- 13, 13, 16, 19, 22
- 2, 11
- In an experiment, 10 participants take the following amount of time (in minutes) to complete a task:
- 7, 19, 2, 10, 42, 32, 18, 19, 44, 5
What is the mean, median, and mode of this data?
- Mean = 20.5, Median = 19.5, Mode = 32
- Mean = 19.8, Median = 18.5, Mode = 19
- Mean = 20.5, Median = 20.5, Mode = 18.5
- Mean = 19.8, Median = 18.5, Mode = 18.5
- Samples of a pharmaceutical product are routinely tested for the presence of a dangerous toxin. The outcome of the test could be formulated as a null and alternative hypothesis in the following way:
- H0: The sample does not contain the toxin.
- H1: The sample contains the toxin.
What is the consequence of making a Type I error in the context of this test?
- The sample is discarded when it actually contains the toxin.
- The sample is discarded when it actually doesn’t contain the toxin.
- The sample is kept when it actually contains the toxin.
- The sample is kept when it actually doesn’t contain the toxin.
- Which of these conditions would result in the highest statistical power for a significance test?
- A significance level of ⍺ = 0.10 and a sample size of n = 150.
- A significance level of ⍺ = 0.10 and a sample size of n = 300.
- A significance level of ⍺ = 0.01 and a sample size of n = 150.
- A significance level of ⍺ = 0.01 and a sample size of n = 300.
- The table shown below illustrates the result obtained from a One-Way ANOVA test. Please fill in the following detail based on the information available in the table:
- What is the Mean Square value for Between-group setting? Also, briefly elaborate how you computed this value.
- What is the Mean Square value for Within-group setting? Also, briefly elaborate how you computed this value.
- What is the value of the F-statistic? Briefly elaborate how you computed this value.
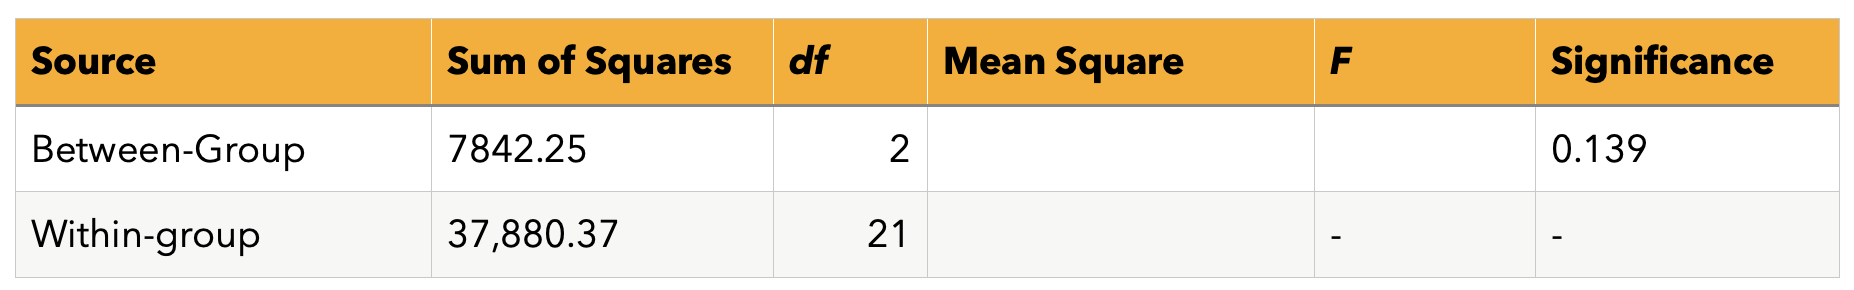
- The table shown above illustrates the result obtained from a One-Way ANOVA test. Given that the FCritical value for the aforementioned values of degrees of freedom, i.e., 2 and 21, is 3.47. Please describe whether the two conditions are significantly different from one another or not? Also, describe how did you reach the conclusion about the statistical significance (or its lack)?